
Equipment Downtime Tracking: How to Measure What Down Machines Really Cost

Ask a fleet manager whether downtime is a problem and the answer is always yes. Ask which five machines lost the most hours last quarter, and why, and the room usually goes quiet.
That's not because nobody cares. It's because most fleets track the repair, not the downtime. The work order shows the parts and labor that went into fixing the machine. It doesn't show that the machine sat for four days waiting on a part, that the job rented a replacement, or that a crew stood around for half a shift before anyone noticed. The repair cost is on paper. The downtime cost is a guess, if it's counted at all.
Equipment downtime tracking closes that gap. Done well, it tells you which machines cost you the most, where the hours actually go and what to fix first. Here's how to set it up without burying your team in paperwork.
What counts as downtime
Start by agreeing on definitions, because a lot of downtime data falls apart right here.
Downtime is time a machine was needed for work but couldn't do it. It comes in two kinds:
- Unscheduled downtime: breakdowns, failures and anything else that takes the machine out of service unexpectedly.
- Scheduled downtime: PMs, planned repairs and inspections that take the machine out of service on purpose.
Idle time is not downtime. A machine parked because there's no work for it is a utilization problem, not a reliability problem. Mix the two together and both numbers become useless. A fleet with too many machines will show lots of idle hours and still have excellent availability.
Track scheduled and unscheduled downtime separately. Scheduled downtime is the price of keeping machines reliable, and it should be planned around the work. Unscheduled downtime is the number you're trying to drive down.
What to record for every down event
The more fields you ask for, the less likely anyone fills them in. For most fleets, these are enough:
- The machine, and the site or job it was on
- When it went down, and when it was back in service
- Scheduled or unscheduled
- What failed: the system or component, in a few words
- What it waited on: parts, a mechanic, transport, a decision, or nothing
- The work order that fixed it
The "what it waited on" field is the one most fleets skip, and it's often the most valuable. In a lot of breakdowns, the actual repair takes a few hours. The machine is down for days because the part wasn't in stock, the mechanic was on another site or the float wasn't available. You can't fix a parts problem if your records say the downtime was a hydraulic failure.
The numbers that matter
Once the records are clean, a few simple calculations tell you most of what you need to know.
Availability is the share of scheduled time a machine was actually able to work.
Availability = (scheduled hours - downtime hours) / scheduled hours
If an excavator was scheduled for 500 hours this quarter and was down for 40 of them, its availability was 460 / 500 = 92%.
Mean time between failures (MTBF) tells you how often a machine breaks down.
MTBF = operating hours / number of unscheduled failures
A loader that ran 1,200 hours and broke down 6 times has an MTBF of 200 hours. If that number keeps falling, the machine is getting less reliable.
Average downtime per failure tells you how long each breakdown keeps the machine out of work.
Average downtime per failure = total unscheduled downtime / number of unscheduled failures
If those 6 breakdowns added up to 60 hours, that's 10 hours per failure. You'll often see this reported as MTTR (mean time to repair), but counting the full downtime is more useful for most fleets, because it includes the waiting. A high number often points to parts or scheduling problems rather than slow repairs.
Downtime events per 1,000 hours makes machines of different ages and workloads comparable. Six breakdowns in 1,200 hours works out to 5 per 1,000 hours.
Utilization is a separate number: hours worked divided by hours available. A machine that was available for 460 hours and worked 300 of them has 65% utilization. Availability tells you whether the machine could work. Utilization tells you whether you needed it.
Put the two side by side and they tell different stories. High availability with low utilization means you may have more machines than work. Low availability with high utilization means you're leaning hard on a machine that keeps letting you down, and that's where the expensive breakdowns come from.
What downtime actually costs
The repair bill is the part of downtime everyone sees. It's rarely the biggest part.
Take a 30-tonne excavator that goes down for three days on a job running 10-hour shifts, and say the repair costs $3,000 in parts and labor. Now add the rest:
- Lost production: 30 hours at an internal rate of, say, $200 an hour is $6,000 of work the machine didn't do.
- A rental replacement: if the job can't wait, a rented machine for the week adds its own bill, plus delivery.
- Idle labor: an operator, and maybe a crew, waiting, reassigned or working around the missing machine.
- Schedule impact: delayed work, overtime to catch up, or penalties if the contract has them.
Before you even count the rental and the knock-on costs, the lost production is double the repair bill. That's why a fleet that only watches repair costs can make bad calls, like deferring a small repair that later causes a three-day breakdown.
Your internal rate is the right number to use for lost production, as long as it's built from real cost per hour. If it isn't, our post on internal rates and the recovery gap explains why that matters, and the equipment cost per hour calculator will help you build a real one.
Where downtime usually hides
When fleets start tracking downtime properly, the same patterns tend to show up.
Waiting on parts. The repair is quick, but the part is days away. The fix is stocking the parts that fail most often, setting minimum stock levels on critical items and being able to see where every part request stands.
Waiting on a mechanic. The machine is down on a remote site and the nearest mechanic is booked. Better field service planning, and knowing exactly which machines are down where, shortens the queue.
Repeat failures. The same component fails on the same machine again and again. Tracking downtime by component exposes these quickly, and they're often the best candidates for a root-cause fix or a rebuild.
Small defects that grew. A leak reported on a walkaround sat for three weeks and turned into a failure. If inspection defects don't reach a backlog someone manages, they come back as unscheduled downtime. That's the problem equipment inspection software is meant to solve.
Late PMs. Services that run past their interval show up later as breakdowns that nobody connects back to the missed service. We covered the math in why PM timing matters.
Turning the data into decisions
Tracking downtime is only worth it if the numbers change what you do. A few ways to use them:
- Rank machines by downtime cost, not repair cost. In most fleets, a handful of machines account for a big share of the lost hours.
- Watch MTBF trends by machine. A steady decline is one of the clearest signs a machine is nearing the end of its economic life. Our post on when to replace a machine shows how to find that point.
- Compare sites. If one site's availability is consistently lower, look at its parts access, mechanic coverage and working conditions.
- Set stocking levels from real failures. The parts that caused the most waiting are the ones to keep on the shelf.
- Plan scheduled downtime around the work. If a machine's next major service is coming up, move it into a gap between jobs instead of the middle of one.
For benchmarks, our page of heavy equipment maintenance statistics collects sourced figures on maintenance cost, utilization and machine life.
Mistakes that make downtime data useless
A few habits can quietly ruin downtime numbers, even when everyone is filling in the records.
Starting the clock when the repair starts. Downtime begins when the machine stops being able to work, not when a mechanic picks up a wrench. If the clock starts late, the waiting disappears from your data, and the waiting is usually the part you can fix.
Leaving events open. A machine gets repaired and goes back to work, but nobody closes the record. A week later it looks like the machine was down for ten days. Closing the downtime event should be part of closing the work order.
Writing "broke down" as the reason. Vague reasons make repeat failures impossible to spot. A few words naming the system or component, like "final drive leak" or "starter", are enough.
Only tracking the big breakdowns. Short stops add up. A machine that loses two hours a week to small problems loses more than 100 hours a year, and none of it shows up if you only record the failures that made it to the shop.
How to start without drowning in paperwork
You don't need a big system to begin. A shared spreadsheet with the fields above, filled in by whoever takes the call when a machine goes down, will tell you more in three months than most fleets have ever known. The key is that one person owns it and reviews it every week. For the maintenance side of the same record, our free equipment maintenance log template tracks services and repairs per machine in PDF or Excel.
The limits show up as the fleet grows. Spreadsheets depend on someone remembering to update them, downtime ends up disconnected from the work orders that fixed it, and waiting time is hard to reconstruct after the fact.
A maintenance system fixes that by recording downtime as part of the work. In Tenmil, a down machine shows up on the Up/Down page with its work order, target dates and description, so everyone can see what's down and when it's expected back. Each machine's overview shows its availability and down events per 1,000 hours, the utilization page compares hours worked against targets, and every part request shows where it stands, from requested to ordered to past its ETA. The same numbers feed the fleet reporting covered on our heavy equipment fleet management software page.
The bottom line
Downtime often costs a fleet more than the repairs themselves, and it's the cost fleets measure least. The repair bill is easy to see. The lost production, the rentals, the idle crews and the waiting are not.
Define downtime clearly, record a handful of fields for every event, and run the basic numbers: availability, MTBF, downtime per failure and utilization. Within a few months you'll know which machines cost you the most, where the hours really go and what to fix first. That's when downtime stops being a complaint and becomes something you can manage.
Related
Put this to work on your own fleet with Tenmil's heavy equipment fleet management software.
Related articles
Is Your Equipment Actually Being Paid For? Internal Rates and the Recovery Gap
Every contractor charges its own projects for its own iron. If that internal rate isn't built from real cost per hour, the fleet quietly under-recovers, and the shortfall hides in overhead where nobody can see it.
Shop Rate: The Number That Decides Whether Your Maintenance Department Is a Cost Center or a Business
If your shop rate doesn't reflect the true cost of running your maintenance operation, you're not fully allocating spend to your equipment — and that leftover becomes an overhead black hole nobody can explain.
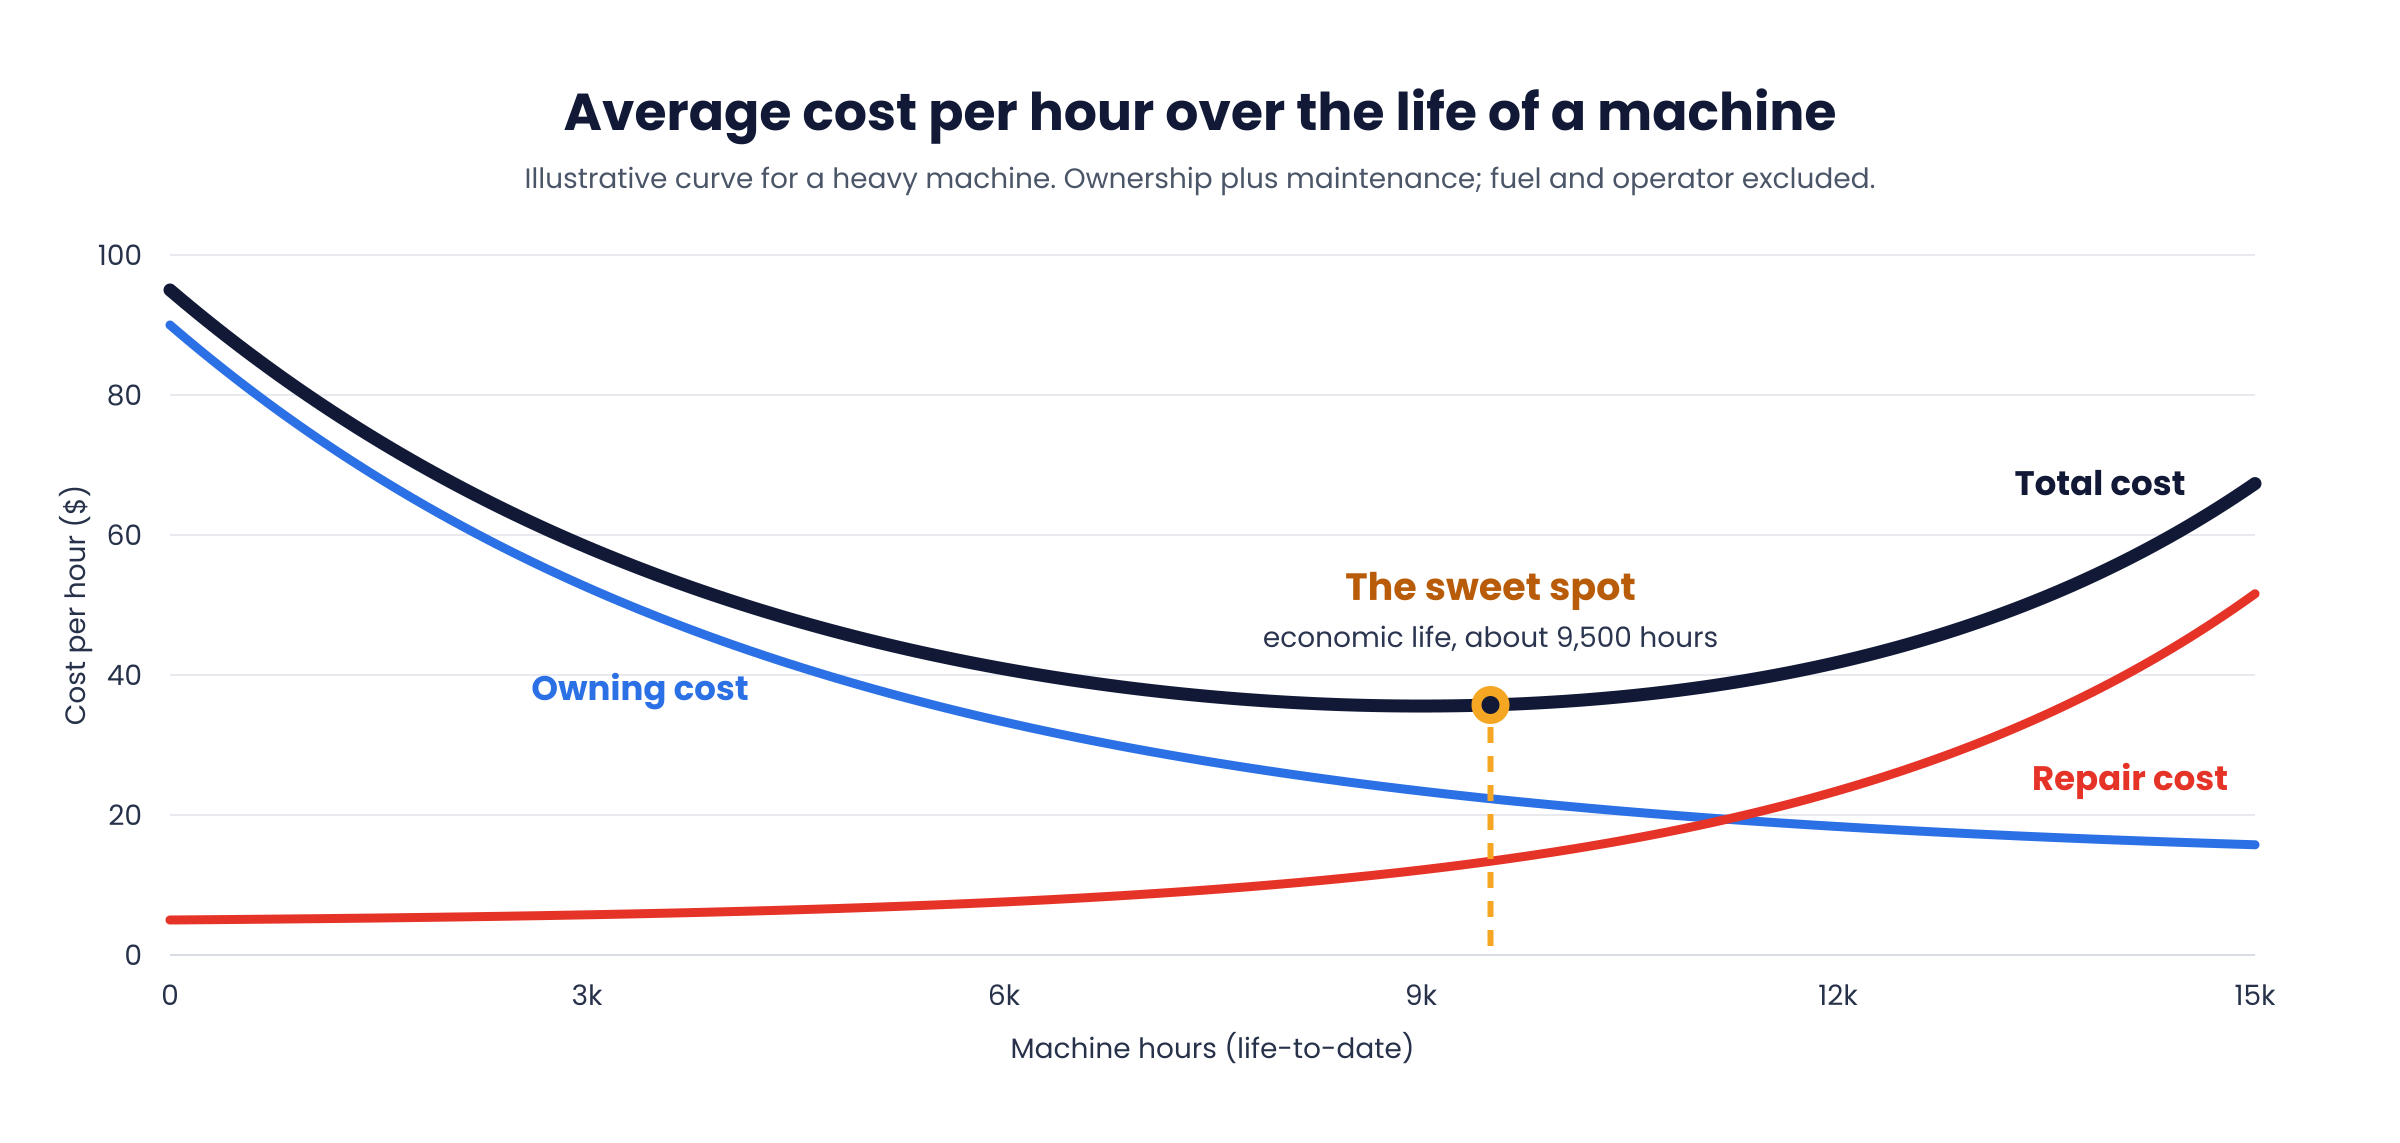
When to Replace a Machine: The Cost Curve Nobody Draws
Every machine has a point where it costs less per hour than it ever will again. Most fleets trade too early or run right past it, because nobody is drawing the cost curve that shows where that point is.