
When to Replace a Machine: The Cost Curve Nobody Draws
Every fleet has one. The machine that's been around longer than most of the crew, that everybody has an opinion about, and that comes up for replacement the same way every time: either it just failed badly enough to force the conversation, or a dealer rep is standing in the yard with a quote. Neither of those is a plan. Both are reactions.
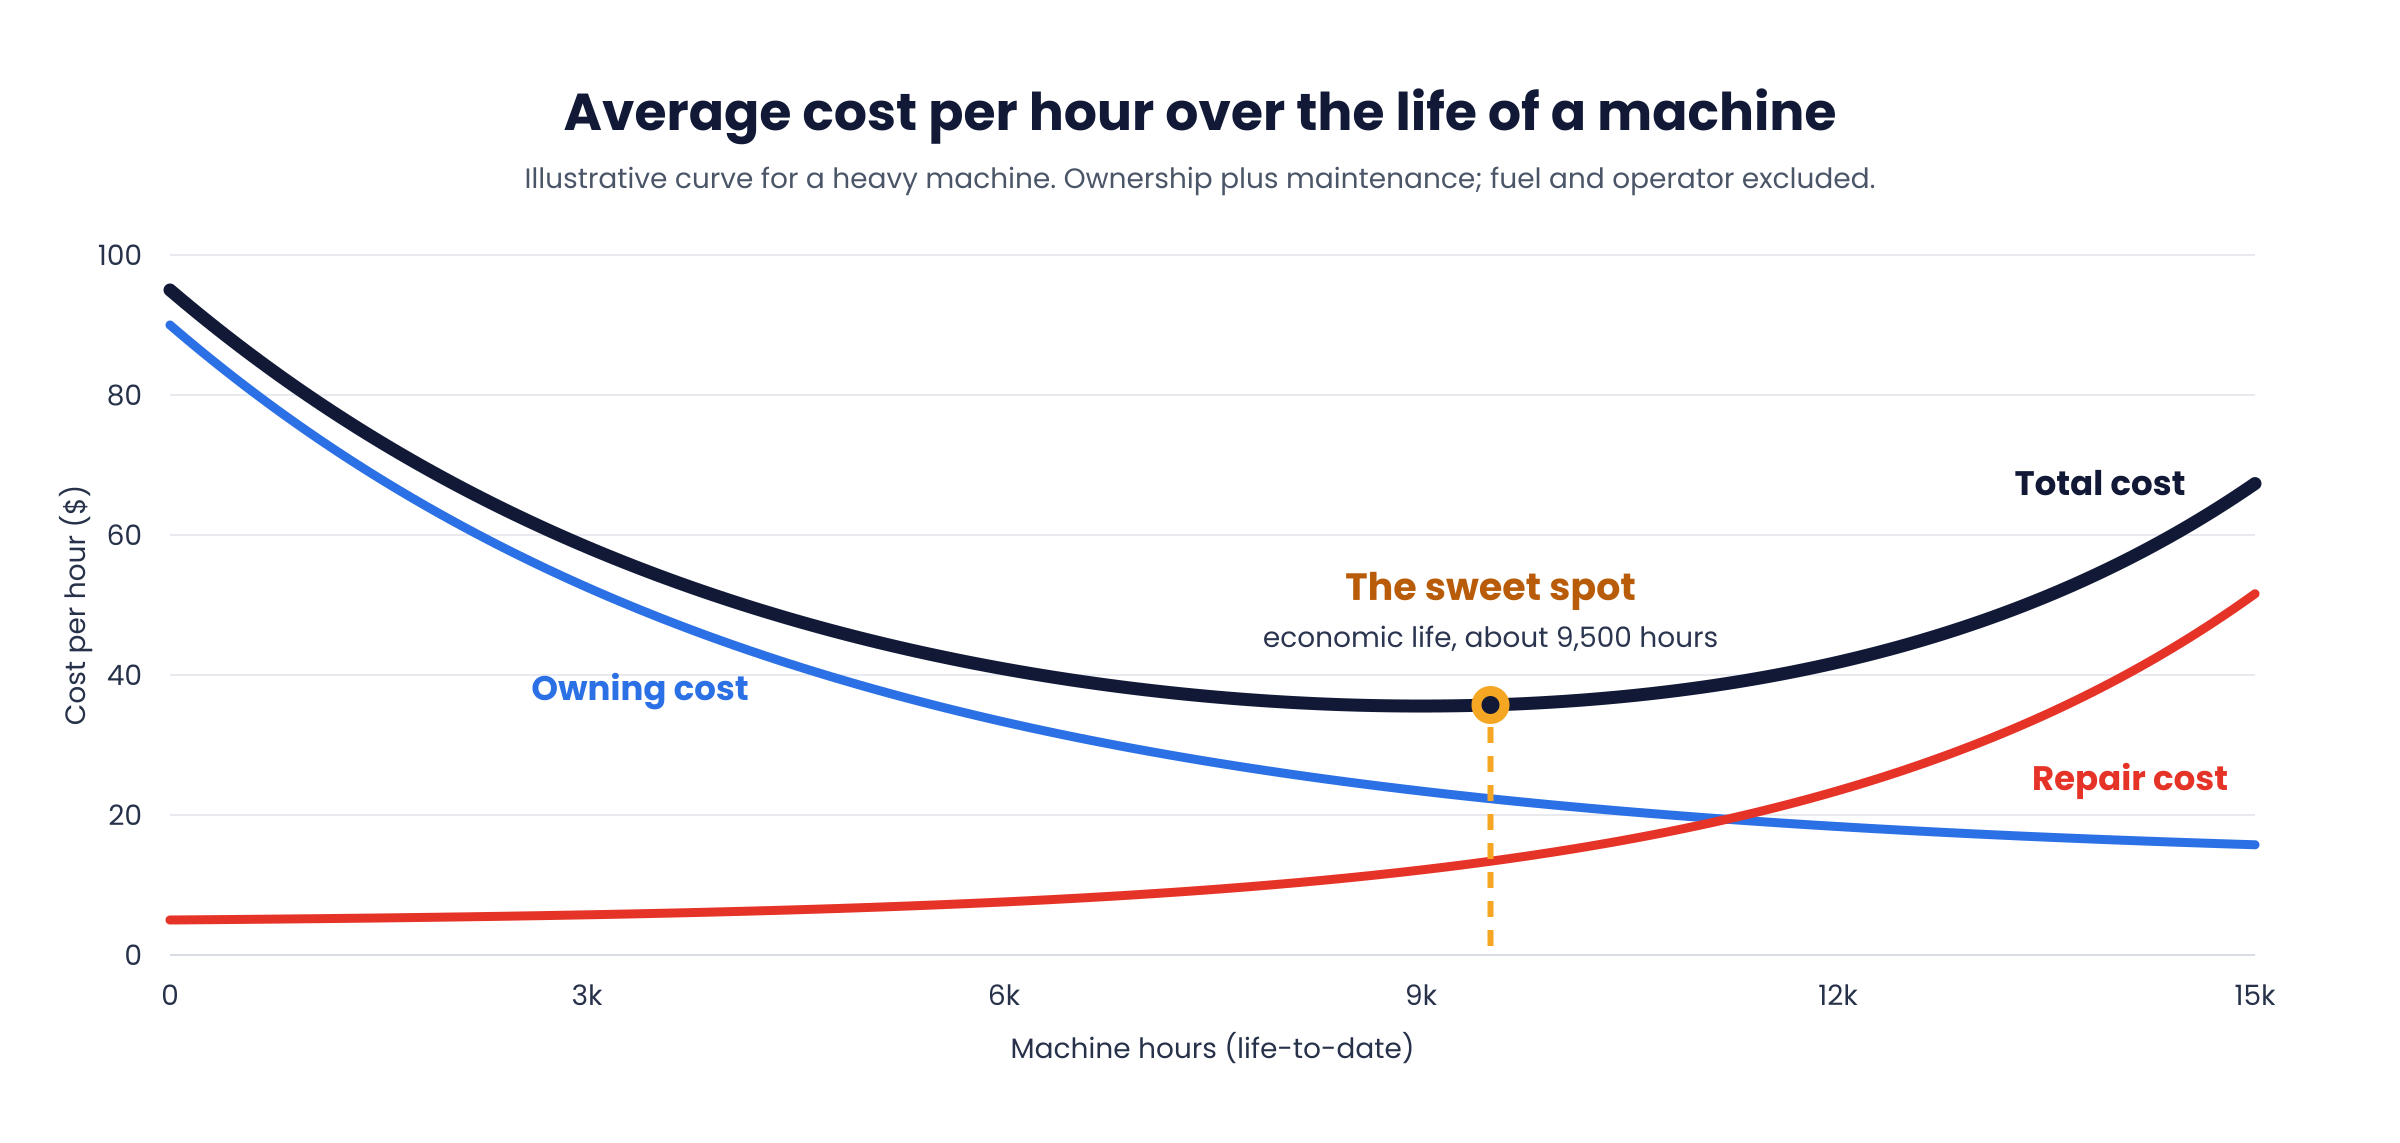
Here's what almost nobody does: draw the curve. Every machine you own has a point in its life where it costs less per hour than it ever has or ever will again. Before that point, you're still paying down the steep front end of depreciation. After it, you're paying for wear that gets more expensive every year. That low point has a name in equipment economics, economic life, and it's when a machine should be replaced. Not when it dies. Not when the lease is up. Not when it hits some round number of hours somebody picked a decade ago.
Most fleets sail past it without noticing, because the curve is built from numbers they don't have on the machine. This is what that curve looks like, why the bottom is so easy to miss, and what it costs to be on the wrong side of it in either direction.
Two Costs Moving in Opposite Directions
The replacement curve is the sum of two costs per hour that move in opposite directions over a machine's life.
The first is ownership cost: depreciation, financing, insurance, and taxes. Depreciation is front-loaded. A machine loses more value in its first year than in any year after, and the drop gets gentler as it ages. Spread that loss across every hour the machine has run and you get an average ownership cost per hour that starts high and falls steadily. At 1,500 hours the machine has to absorb its brutal first-year depreciation across just those 1,500 hours. At 9,000 hours the loss is spread across six times as many, and the year-six depreciation was a fraction of year one's anyway. Ownership cost per hour only goes one direction: down.
The second is maintenance and repair cost: labor, parts, and outside services, from a 500-hour oil service to an engine rebuild. This one goes the other way. A new machine under warranty costs you PMs and not much else. Then the first wear items come due. Undercarriage, hydraulic pumps, cylinder reseals, cooling system, then the big ones: engine, transmission, final drives, swing drive. Every year the average maintenance cost per hour climbs, and the climb steepens as major components reach the end of their first life.
Add the two together and you get a U. It starts high, driven by ownership. It drops as depreciation thins out. It bottoms. Then it climbs, driven by repairs. The bottom of that U is the machine's economic life, and it's the cheapest hour that machine will ever give you.
What the Curve Looks Like in Real Numbers
Take a $400,000 excavator running about 1,500 hours a year, and follow the average total cost per hour, ownership plus maintenance, as it ages. Fuel and operator wages are left out on purpose: they matter to your bid rate, but they stay roughly flat with age and don't move the bottom of the curve much.
Year one, the machine loses around $88,000 in value. Add financing, insurance, and taxes and you're near $106,000 of ownership cost spread over 1,500 hours: about $71 per hour. Maintenance that year is PMs and little else, call it $9,000, or $6 per hour. Total: about $77 per hour.
Now jump ahead a little past year six, to around 9,500 hours. Cumulative ownership cost is up over $315,000, but it's spread across so many hours that the average has fallen to about $33 per hour. Repairs have started to bite: the machine has been through hoses, cylinder reseals, and its first undercarriage, cumulative maintenance is around $140,000, or roughly $15 per hour on average, with the current year running closer to $30. Total average: about $48 per hour. That's the bottom of the curve for this machine.
Keep going. By year twelve, at 18,000 hours, ownership is down to about $24 per hour, but cumulative repairs have piled up to nearly $640,000, an average of about $35 per hour, and the current year is burning close to $80 an hour on its own. Total average: about $59 per hour, and rising every year.
Two things stand out. First, the bottom is shallow. Years five through eight all sit within a dollar or two of each other, which is exactly why fleets slide through it without noticing. Nothing dramatic happens at 9,500 hours. Second, by the time the climb is obvious in the annual numbers, you're years past the point where you should have acted.
The Cost of Replacing Too Early
Trading a machine before the bottom of the curve feels safe. Newer iron, warranty coverage, better uptime, happier operators. But look at what it does to the numbers.
Depreciation is the biggest single cost in a machine's life, and most of it happens early. Trade at 4,500 hours and you've absorbed the steepest part of that loss and then walked away right as the machine was about to give you its cheapest hours. Then you do it again with the replacement. A fleet on a short trade cycle is paying first-year depreciation over and over, on every machine, forever. In the example above, a fleet that trades every excavator at 4,500 hours pays about $55 for every hour it runs. One that trades at 9,500 pays about $48. Seven dollars an hour, across 1,500 hours a year, across a 40-unit fleet, is $420,000 a year of cost you volunteered for.
There are reasons to trade early anyway: a strong resale market, a warranty program, a jobsite that can't tolerate downtime, a tax situation. Those can all be the right call. But they should be made against the curve, as a known premium you're choosing to pay, not by instinct.
The Cost of Holding On Too Long
This is the more common mistake, and the more expensive one, because the costs on this side of the curve compound and hide.
The obvious cost is repairs. Past the bottom, the annual number climbs, and it doesn't climb evenly. It jumps when major components come due, and on an older machine they come due in clusters. But once you're on this side of the curve, average cost per hour isn't even the right lens. The question that matters is what the next year of that machine's life will cost compared to what a replacement would cost across its own life. In the year-twelve example, the old excavator is losing only about $8,000 in value but burning close to $120,000 in repairs. With financing and insurance, that's roughly $90 for every hour it runs that year, against a replacement that would average about $48 across its economic life. Every hour on the old machine costs about $40 more than it needs to, and that gap widens each year you keep it.
Then come the costs that never show up on a work order. Old machines break down more, and unscheduled downtime costs far more than the repair invoice: idle operators, idle crews, a rental to cover the gap, schedule slip. Downtime rises with age just like repair cost does, and almost nobody puts it on the curve. If they did, the bottom would move earlier than the pure cost numbers suggest. Older machines also burn more fuel, lose resale value every month you wait, and are worth less to a buyer once the hour meter tells its own story.
And there's the psychology, which is where most late-replacement decisions actually get made. A fleet drops $45,000 into an undercarriage and a hydraulic pump, and now the machine "has to earn that back," so it stays another three years. That money is gone whether the machine stays or goes. The only question is what the next 4,500 hours will cost, and a fresh undercarriage doesn't fix an engine at 15,000 hours. The mirror-image mistake is just as common: one ugly repair year triggers a replacement on a machine that was still sitting near the bottom of its curve. A single spike isn't a trend. The cumulative average and the direction it's moving are what tell you where you are.
Why Most Fleets Can't See Their Own Curve
Economic life is not a rule of thumb. It's different for every unit, and it moves with application, duty cycle, and how well the machine was maintained. An excavator digging blasted rock and its twin doing utility trench work in sand can bottom out thousands of hours apart. Two identical dozers bought the same week can have curves that look nothing alike by year six, because one ran on time on its PMs and one didn't. Trading everything at 10,000 hours or seven years, whichever comes first, treats all of them the same, which guarantees you're early on some and late on others.
So the only way to know where a specific machine sits is to have its actual numbers: every dollar of labor, parts, and outside service that hit the unit, its ownership costs, and its real hours, all on the same asset record. That's exactly what most fleets don't have. Repair costs sit in accounting by vendor and by month, not by unit. Labor is a payroll total, not hours on a machine. Ownership costs live in a depreciation schedule nobody in the shop has seen. Hours are whatever the last person wrote on a timesheet. So when the replacement question comes up, someone opens a spreadsheet, pulls what they can find, and the curve gets replaced with a feeling.
How a CMMS Draws the Curve for You
The curve draws itself if the data is captured where it happens. Every work order that closes carries labor hours at your shop rate, parts at what you actually paid for them, and any third-party charges from the associated purchase order, and all of it lands on the asset. Meter readings keep the hours current. Ownership costs are entered once. From there, cost per hour is a running number, not a project.
Tenmil is built around this. Maintenance and repair costs accumulate on each unit live, work order by work order, and are tracked against actual meter hours, so the average maintenance cost per hour and its trend are visible on the asset without anyone compiling anything. Ownership costs sit alongside them, which is what lets the two curves be laid on top of each other. Tenmil plots the resulting equipment lifecycle cost graph for each asset, cumulative cost against cumulative hours, so you can see where the machine sits relative to the bottom of its curve, whether it's still falling, flat, or climbing, and how it compares to similar units in the fleet.
That changes the replacement conversation. Instead of reacting to a failure or a quote, you can run the fleet on a schedule: review the units that have crossed the bottom, see how far past it they are, and plan disposal while the resale value is still worth something. The dealer rep still shows up. He just doesn't get to set the timing anymore.
Draw the Curve
Every machine has a point where it is as cheap as it will ever be, and every hour after it costs more than it needs to. Replace too early and you pay the front end of depreciation again and again. Hold on too long and you pay rising repairs, rising downtime, and shrinking resale, all at once. Neither side of the curve announces itself. The bottom is shallow, the climb is gradual, and by the time it's obvious you're years late.
The fix isn't a smarter rule of thumb. It's having the machine's actual costs on the machine, updated as the work happens, so the curve is something you can look at instead of something you argue about. Draw the curve, and the replacement decision stops being a gut call and becomes arithmetic.
Sources
About the numbers in this post. The $400,000 excavator and every dollar figure on its curve are a modeled example with round numbers, not survey data. The shape of the curve is the point; the numbers for your own machines come from their work orders. The method and the published reference points come from the sources below.
- Mike Vorster, Total Cost and Economic Life, Construction Equipment, April 21, 2017. The cumulative cost curve and the definition of economic life as the point where the average cost per hour is lowest, which is the curve this post draws.
- U.S. Army Corps of Engineers, EP 1110-1-8, Construction Equipment Ownership and Operating Expense Schedule, Volume 1, November 2018. The ownership-plus-operating cost structure and the economic-life assumptions behind published hourly rates.
- Equipment World, 2026 Tech & Spec Survey, 2026. Contractors report replacing excavators, dozers and backhoes at 8,000 to 10,000 hours, loaders at 10,000 to 12,000 and articulated trucks at 12,000 to 14,000; the 9,500-hour example above sits inside that band. Also on our heavy equipment maintenance statistics page.
- U.S. Environmental Protection Agency, Office of Transportation and Air Quality, Median Life, Annual Activity, and Load Factor Values for Nonroad Engine Emissions Modeling (NR-005d), 2010. Annual activity defaults of 1,092 hours for excavators, the scale behind the 1,500 hours a year used above.
- U.S. Federal Emergency Management Agency, Schedule of Equipment Rates, 2025. Published ownership-plus-operating hourly rates by machine class, a public reference point for the ownership and repair figures above. Also on our heavy equipment maintenance statistics page.
Related
Put this to work on your own fleet with Tenmil's equipment cost per hour calculator.
Related articles
Is Your Equipment Actually Being Paid For? Internal Rates and the Recovery Gap
Every contractor charges its own projects for its own iron. If that internal rate isn't built from real cost per hour, the fleet quietly under-recovers, and the shortfall hides in overhead where nobody can see it.
Shop Rate: The Number That Decides Whether Your Maintenance Department Is a Cost Center or a Business
If your shop rate doesn't reflect the true cost of running your maintenance operation, you're not fully allocating spend to your equipment — and that leftover becomes an overhead black hole nobody can explain.
The Hidden Revenue Engine: Why Equipment Cost Per Hour Is the Most Important Number in Your Fleet
Your equipment doesn't just sit on a jobsite — it earns. Cost per hour tells you exactly how much it costs to generate that revenue, and getting it wrong means you're bleeding money on every bid.